计算 +load 方法的耗时

在 pre-main 时期,objc 会向 dyld 注册一个 init 回调,当 dyld 将要执行载入 image 的 initializers 流程时 (依赖的所有 image 已走完 initializers 流程时),init 回调被触发,在这个回调中,objc 会按照父类-子类-分类顺序调用 +load 方法。因为 +load 方法执行地足够早,并且只执行一次,所以我们通常会在这个方法中进行 method swizzling 或者自注册操作。也正是因为 +load 方法调用时间点的特殊性,导致此方法的耗时监测较为困难,而如何使监测代码先于 +load 方法执行成为解决此问题的关键点。

关于初始化流程的执行顺序,NSObject 文档中有以下说明

  1. All initializers in any framework you link to.
  2. All +load methods in your image.
  3. All C++ static initializers and C/C++ __attribute__(constructor) functions in your image.
  4. All initializers in frameworks that link to you.

为了方便描述,这里我统称 2、3 步骤为 initializers 流程。可以看到,只要我们把监测代码塞进依赖动态库的 initializers 流程里(监测耗时库),就可以解决执行时间问题 。考虑到工程内可能添加了其他动态库,我们还需要让监测耗时库的初始化函数早于这些库执行。解决了监测代码的执行问题,接下来就可以实现这些代码了,本文采用在 __attribute__(constructor) 初始化函数中 hook 所有 +load 方法来计算原 +load 执行的时间。

获取需要监测的 image

由于 dyld 加载的镜像中包含系统镜像,我们需要对这些镜像做次过滤,获取需要监测的镜像 ,也就是主 App 可执行文件和添加的自定义动态库对应的镜像

1
2
3
4
5
6
7
8
9
10
11
12
13
14
15
16
17
18
19
20
21
22
23
24
25
26
27
28
static bool isSelfDefinedImage(const char *imageName) {
return !strstr(imageName, "/Xcode.app/") &&
!strstr(imageName, "/Library/PrivateFrameworks/") &&
!strstr(imageName, "/System/Library/") &&
!strstr(imageName, "/usr/lib/");
}

static const struct mach_header **copyAllSelfDefinedImageHeader(unsigned int *outCount) {
unsigned int imageCount = _dyld_image_count();
unsigned int count = 0;
const struct mach_header **mhdrList = NULL;

if (imageCount > 0) {
mhdrList = (const struct mach_header **)malloc(sizeof(struct mach_header *) * imageCount);
for (unsigned int i = 0; i < imageCount; i++) {
const char *imageName = _dyld_get_image_name(i);
if (isSelfDefinedImage(imageName)) {
const struct mach_header *mhdr = _dyld_get_image_header(i);
mhdrList[count++] = mhdr;
}
}
mhdrList[count] = NULL;
}

if (outCount) *outCount = count;

return mhdrList;
}

上面代码逻辑很简单,遍历 dyld 加载的镜像,过滤掉名称中包含 /Xcode.app//Library/PrivateFrameworks//System/Library//usr/lib/ 的常见系统库,剩下的就是我们添加的自定义镜像和主镜像了。

获取定义了 +load 方法的类和分类

目前我所知获取拥有 +load 类和分类的方法有两种,一种是通过 runtime api ,去读取对应镜像下所有类及其元类,并逐个遍历元类的实例方法,如果方法名称为 load ,则执行 hook 操作;一种是和 runtime 一样,直接通过 getsectiondata 函数,读取编译时期写入 mach-o 文件 DATA 段的 __objc_nlclslist__objc_nlcatlist,这两节分别用来保存 no lazy class 列表和 no lazy category 列表,所谓的 no lazy 结构,就是定义了 +load 方法的类或分类。

上文说过 objc 会向 dyld 注册一个 init 回调,其实这个注册函数还会接收一个 mapped 回调 _read_images,dyld 会把当前已经载入或新添加的镜像信息通过回调函数传给 objc 设置程序,一般来说,除了手动 dlopen 的镜像外,在 objc 调用注册函数时,工程运行所需的镜像已经被 dyld 加载进内存了,所以 _read_images 回调会立即被调用, 并读取这些镜像 DATA 段中保存的类、分类、协议等信息。对于 no lazy 的类和分类,_read_images 函数会提前对关联的类做 realize 操作,这个操作包含了给类开辟可读写的信息存储空间、调整成员变量布局、插入分类方法属性等操作,简单来说就是让类可用 (realized)。值得注意的是,使用 objc_getClass 等查找接口,会触发对应类的 realize 操作,而正常情况下,只有我们使用某个类时,这个类才会执行上述操作,即类的懒加载。反观 +initialize ,只有首次向类发送消息时才会调用,不过两者目的不同,+initialize 更多的是提供一个入口,让开发者能在首次向类发送消息时,处理一些额外业务。

回到上面的两种方法,第一种方法需要借助 objc_copyClassNamesForImageobjc_getClass 函数,而后者会触发类的 realize 操作,也就说需要把读取镜像中访问的所有类都变成 realized 状态,当类较多时,这样做会比较明显地影响到 pre-main 的整体时间,并且 objc_copyClassNamesForImage 无法获取自定义 image 中分类的信息,特别是系统分类,比如定义了 +load 方法的 NSObject+Custom 分类,对自定义 image 调用 objc_copyClassNamesForImage 函数,其返回值将不会包含 NSObject 类,这导致后续操作将不会包含 NSObject 类,也就无法测量它的 +load 耗时(可以使用 objc_copyClassList 获取所有类,并判断类方法列表是否有 +load 方法来规避这个问题,但是和 objc_copyClassNamesForImage 一样,此方法将更加耗时,也无法确认 +load 方法属于那个分类),所以本文采用了第二种方法:

1
2
3
4
5
6
7
8
9
10
11
12
13
14
15
16
17
18
static NSArray <LMLoadInfo *> *getNoLazyArray(const struct mach_header *mhdr) {
NSMutableArray *noLazyArray = [NSMutableArray new];
unsigned long bytes = 0;
Class *clses = (Class *)getDataSection(mhdr, "__objc_nlclslist", &bytes);
for (unsigned int i = 0; i < bytes / sizeof(Class); i++) {
LMLoadInfo *info = [[LMLoadInfo alloc] initWithClass:clses[i]];
if (!shouldRejectClass(info.clsname)) [noLazyArray addObject:info];
}

bytes = 0;
Category *cats = getDataSection(mhdr, "__objc_nlcatlist", &bytes);
for (unsigned int i = 0; i < bytes / sizeof(Category); i++) {
LMLoadInfo *info = [[LMLoadInfo alloc] initWithCategory:cats[i]];
if (!shouldRejectClass(info.clsname)) [noLazyArray addObject:info];
}

return noLazyArray;
}

hook 类和分类的 +load 方法

获得了拥有 +load 方法的类和分类,就可以 hook 对应的 +load 方法了。如上一节所说,no lazy 分类的方法在 _read_images 阶段就已经插入到对应类的方法列表中了,所以我们可以在元类的方法列表中拿到在类和分类中的定义的 +load 方法:

1
2
3
4
5
6
7
8
9
10
11
12
13
14
15
16
17
18
19
20
21
22
23
static void hookAllLoadMethods(LMLoadInfoWrapper *infoWrapper) {
unsigned int count = 0;
Class metaCls = object_getClass(infoWrapper.cls);
Method *methodList = class_copyMethodList(metaCls, &count);
for (unsigned int i = 0, j = 0; i < count; i++) {
Method method = methodList[i];
SEL sel = method_getName(method);
const char *name = sel_getName(sel);
if (!strcmp(name, "load")) {
LMLoadInfo *info = nil;
if (j > infoWrapper.infos.count - 1) {
info = [[LMLoadInfo alloc] initWithClass:infoWrapper.cls];
[infoWrapper insertLoadInfo:info];
LMAllLoadNumber++;
} else {
info = infoWrapper.infos[j];
}
++j;
swizzleLoadMethod(infoWrapper.cls, method, info);
}
}
free(methodList);
}

更新:处理多个动态库时,无法利用读取的 image 顺序对方法进行匹配,因为读取的 image 顺序并未考虑依赖关系,和 objc 初始化时遍历的 image 顺序并不一致,所以这里的处理方式是错误的,为了保证准确性,这里依旧需要使用 +load 方法的 imp 地址做对比,具体更新

为了让 infos 列表能和类方法列表中的 +load 方法顺序一致,在构造 infoWrapper 时,我按照后编译分类-先编译分类-类次序,将类信息追加入 infos 列表中,然后在遍历元类的方法列表时,将对应的 LMLoadInfo 对象取出以设置 +load 方法执行耗时变量:

1
2
3
4
5
6
7
8
9
10
11
12
13
14
15
16
17
18
19
20
static void swizzleLoadMethod(Class cls, Method method, LMLoadInfo *info) {
retry:
do {
SEL hookSel = getRandomLoadSelector();
Class metaCls = object_getClass(cls);
IMP hookImp = imp_implementationWithBlock(^ {
info->_start = CFAbsoluteTimeGetCurrent();
((void (*)(Class, SEL))objc_msgSend)(cls, hookSel);
info->_end = CFAbsoluteTimeGetCurrent();
if (!--LMAllLoadNumber) printLoadInfoWappers();
});

BOOL didAddMethod = class_addMethod(metaCls, hookSel, hookImp, method_getTypeEncoding(method));
if (!didAddMethod) goto retry;

info->_sel = hookSel;
Method hookMethod = class_getInstanceMethod(metaCls, hookSel);
method_exchangeImplementations(method, hookMethod);
} while(0);
}

在所有的 +load 方法执行完毕后,输出工程的 +load 耗时信息。

打印所有 +load 耗时信息

基本上我们统计 +load 的耗时主要想看到两个信息:总耗时和最大耗时,所以这里我除了输出了总耗时,还按照 +load 执行时间降序打印出类和分类:

1
2
3
4
5
6
7
8
9
10
11
12
13
14
15
16
17
18
19
20
static void printLoadInfoWappers(void) {
NSMutableArray *infos = [NSMutableArray array];
for (LMLoadInfoWrapper *infoWrapper in LMLoadInfoWappers) {
[infos addObjectsFromArray:infoWrapper.infos];
}
NSSortDescriptor *descriptor = [NSSortDescriptor sortDescriptorWithKey:@"duration" ascending:NO];
[infos sortUsingDescriptors:@[descriptor]];

CFAbsoluteTime totalDuration = 0;
for (LMLoadInfo *info in infos) {
totalDuration += info.duration;
}
printf("\n\t\t\t\t\t\t\tTotal load time: %f milliseconds", totalDuration * 1000);
for (LMLoadInfo *info in infos) {
NSString *clsname = [NSString stringWithFormat:@"%@", info.clsname];
if (info.catname) clsname = [NSString stringWithFormat:@"%@(%@)", clsname, info.catname];
printf("\n%40s load time: %f milliseconds", [clsname cStringUsingEncoding:NSUTF8StringEncoding], info.duration * 1000);
}
printf("\n");
}

例子输出如下:

1
2
3
4
5
6
7
8
9
10
               Total load time: 2228.866100 milliseconds
B(sleep_1_s) load time: 1001.139998 milliseconds
DynamicFramework(sleep_1_s) load time: 1001.088023 milliseconds
A(sleep_100_ms) load time: 101.074934 milliseconds
A(copy_class_list) load time: 68.153024 milliseconds
ViewController(sleep_50_ms) load time: 51.078916 milliseconds
DynamicFramework load time: 4.286051 milliseconds
ViewController(sleep_1_ms) load time: 1.210093 milliseconds
ViewController load time: 0.580072 milliseconds
A load time: 0.254989 milliseconds

制作动态库集成至主工程

编写完监测代码,需要将其打包成动态库加入工程中,也就是 Embedded Binaries 和 Linked Frameworks And Libraries:

  • Embedded Binaries 一栏表示把列表中的二进制文件,集成到最终生成的 .app 文件中
  • Linked Frameworks And Libraries 一栏表示链接时,按顺序依次链接列表中的库文件

所以如果是我们自己添加的库文件,需要将库文件添加进上面的两个列表中,否则要么 dyld 加载库镜像时出现 Library not loaded 错误,要么直接不链接这个库文件。而系统库则不需要设置 Embedded 栏 ,只需要设置 Linked 栏,因为实际设备中会预置这些库。

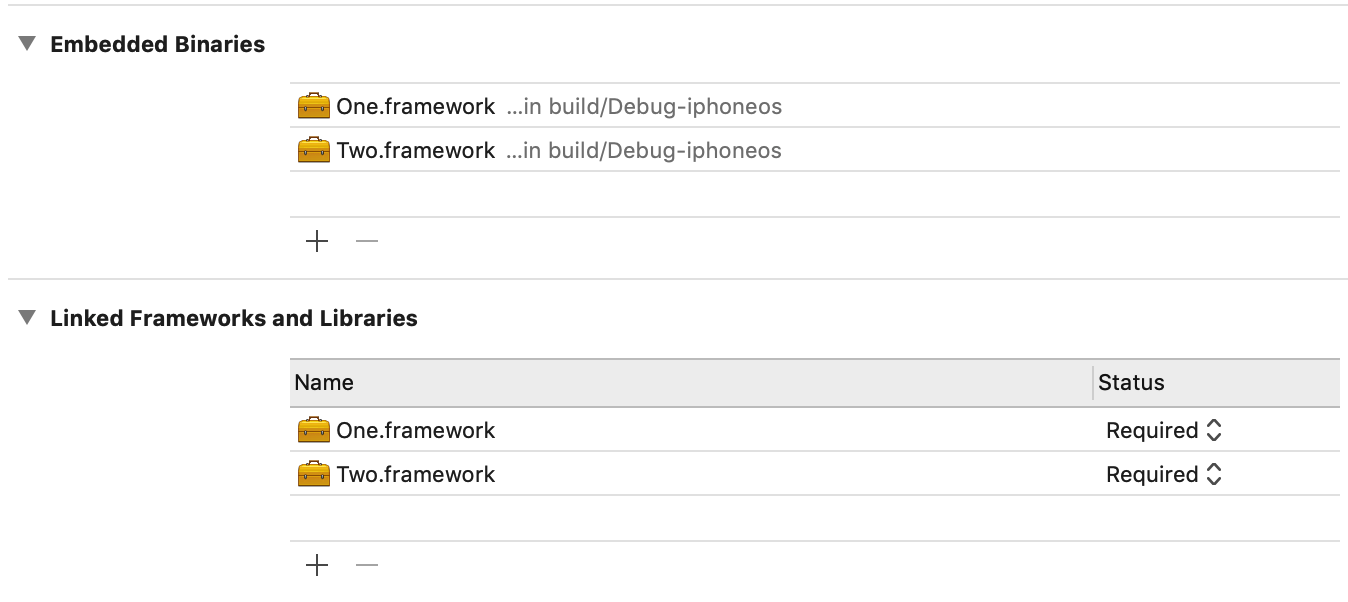
以上图为例,Linked 栏中库的排列顺序,最终会体现在链接阶段命令的入参顺序上:

1
2
3
4
// Build Message

Ld ...
.../clang ... -framework One -framework Two ... -o .../Demo.app/Demo

当参与链接的是动态库时,在生成主 App 可执行文件的 Load Commands 中,这些动态库对应的 LC_LOAD_DYLIB 排列顺序将和入参顺序一致。

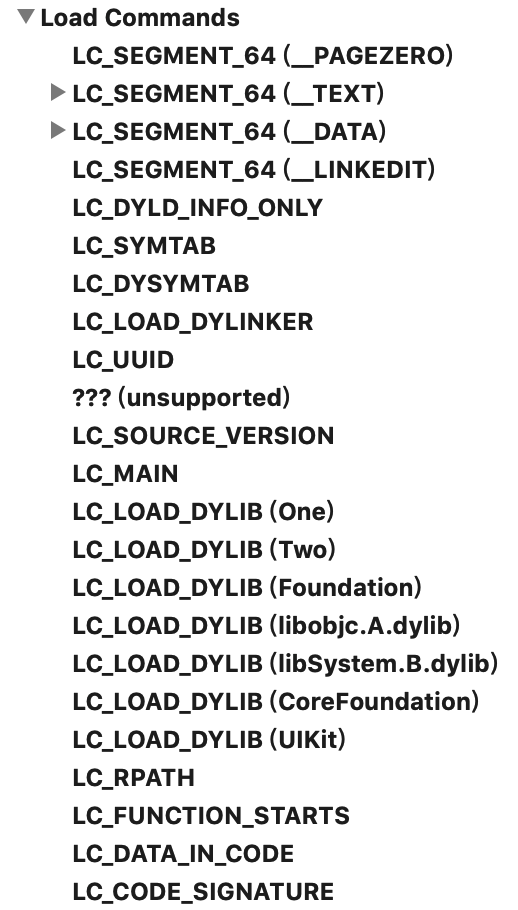
当这些动态库间不存在依赖关系时,其初始化函数的调用顺序将和 LC_LOAD_DYLIB 的排列顺序一致,否则会优先调用依赖库的初始化函数。

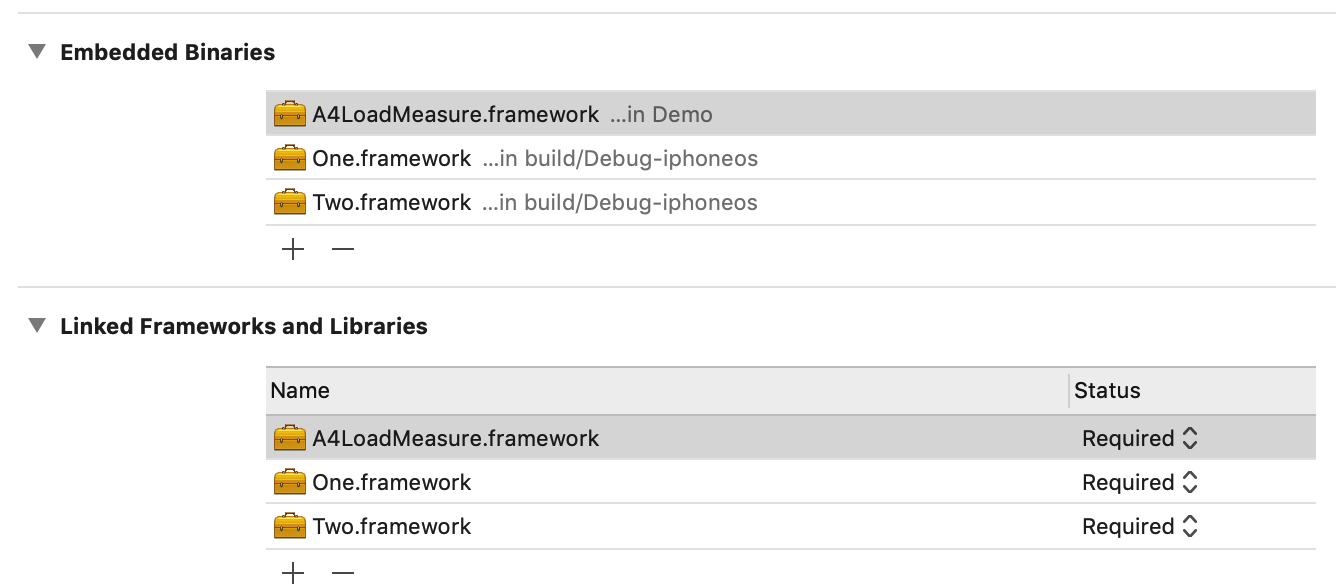
因为监测耗时库不依赖其他自定义动态库,所以我们直接将监测耗时库拖入工程,并调整其至 Linked 栏首位即可。

制作 pod 集成至主工程

如果工程依赖由 CocoaPods 管理,我可能想要通过以下语句引入 +load 监测库:

1
pod 'A4LoadMeasure', configuration: ['Debug']

这样只有在 Debug 状态下才会引入监测库。需要注意的是 CocoaPods 引入的动态库是由 xcconfig 文件的 OTHER_LDFLAGS 设置的,我们无法通过调整其在 Linked 栏的顺序来决定链接顺序,不过 Other Linker Flags 中 -framework 指定的库优先级比 Linked 栏中的要高,所以我们只需要关心 CocoaPods 如何生成 xcconfig 的 OTHER_LDFLAGS 字段即可。

CocoaPods 在生成 Pods 工程时,会创建一个名称为Pods-主target名的 target (AggregateTarget),这个 target 的 xcconfig 汇集了所有 pods target 的 xcconfig ,我们看下 CocoaPods 是如何创建这个文件的:

1
2
3
4
5
6
7
8
9
10
11
12
13
14
15
16
17
18
19
20
21
22
23
24
25
26
27
28
29
30
# Pod::Generator::XCConfig::AggregateXCConfig
def generate
...
@xcconfig = Xcodeproj::Config.new(config)
...
XCConfigHelper.generate_other_ld_flags(target, pod_targets, @xcconfig)
...
@xcconfig
end
def save_as(path)
generate.save_as(path)
end

# Xcodeproj::Config
def save_as(path)
# 间接执行了 to_hash 并保存至 xcconfig 文件中
end
def to_hash(prefix = nil)
...
[:libraries, :frameworks, :weak_frameworks, :force_load].each do |key|
modifier = modifiers[key]
sorted = other_linker_flags[key].to_a.sort
if key == :force_load
list += sorted.map { |l| %(#{modifier} #{l}) }
else
list += sorted.map { |l| %(#{modifier}"#{l}") }
end
end
...
end

可以看到,xcconfig 在保存时才对链接库进行排序,如 frameworks 会根据名称生序排序后再 map 成 -framework 库名 的形式保存在文件的 OTHER_LDFLAGS 字段中。所以我们只要保证监测库名比 Pods 工程引入的其他自定义动态库小就可以了,由于 0LoadMeasure、A+LoadMeasure 等非主流名称无法生成正确的 modulemap ,所以我采用 A4LoadMeasure 作为监测库名,A4 的值比 AA 等英文字母组成的名称小,针对这种情况已经基本够用了,毕竟很少会有用 A0 作为名称前缀的组件或动态库。

经过以上命名处理,开发者就可以直接通过 CocoaPods 引入监测库,而不需要进行额外的调整操作。

小结

本文讨论了使用 hook 监测 +load 执行时间方案,并结合 CocoaPods 实现了一行代码集成耗时监测的功能。详细代码可查看 A4LoadMeasure ,或者可以直接使用以下语句引入:

1
pod 'A4LoadMeasure', configuration: ['Debug']

参考

手淘iOS性能优化探索

Hook所有+load方法(包括Category)

Embedded Binaries 和 Linked Frameworks And Libraries的区别